Location of Sampling Stations: The study is comprised of two units on Konza Prairie that line the west side of Kansas Highway 177. The south unit (watersheds C3A, C3B, and C3C) consists of 452 acres and is stocked with 56 cow calf pairs, with 27 pairs on the smaller adjacent control plot (watershed C1A). The replicating north unit (watersheds C3SA, C3SB and C3SC) is stocked with a comparable 103 pairs on 829 acres with 19 pairs on the adjacent control plot (watershed C1SB).
Each unit has been divided into three sections. Cattle will be allowed to roam the entire unit. But only one-third of the unit will be burned each year on a rotating basis. See 'Burn History' on the Konza LTER web site.
Frequency of Sampling: Cattle will be weighed and assigned a body condition score on or about May 1, July 15, and October 1 of each grazing season. Reproductive success will be assessed on or about July 15 and October 1 of each grazing season.
Variable Measured: Weights and condition of cows and calves. Reproductive performance of cows.
Methods: Cow body-weight (BW) and body-condition-score (BCS) measurements are obtained on the day individual cows calve, at the time of fixed-time artificial insemination (AI), and at weaning. At each time point, cow BCS is assigned (1 to 9 scale; 1 = emaciated, 9 = morbidly obese) by 3 trained observers that are blinded to treatment; the average of 3 scores is recorded. Calf BW 1s recorded at birth, at the time of fixed-time AI, and at weaning.
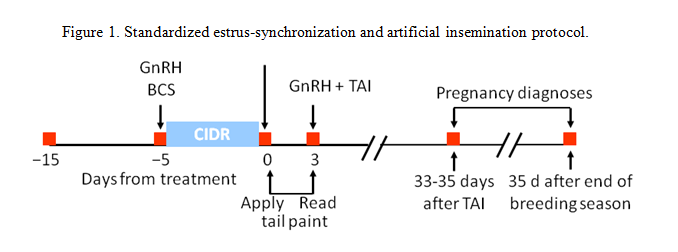
Ovulation is synchronized using a 5-day CO-Synch + controlled-intervaginal-drug-release (CIDR) protocol (Figure 1) and cows are inseminated 72 hours after CIDR removal. Cows are exposed to fertile bulls for natural-service breeding beginning 10 days after fixed-time AI for 50 days. Conception to fixed-time AI is determined via ultrasound 33 to 35 days after AI and final pregnancy rate was determined via rectal palpation approximately 120 days after AI. Subsequent calving dates are recorded in order to establish distribution over a 60-day calving season.
Summary of All Changes:
2010: South Unit initiated along with adjacent control plot (watersheds C3A, C3B, C3C and C1A).
Spring 2011: North Unit initiated (watersheds C3SA, C3SB, C3SC and C1SB).
For additional metadata information see: http://lter.konza.ksu.edu/sites/default/files/DC.pdf
For additional methods information see: http://lter.konza.ksu.edu/sites/default/files/MM.pdf